It is often useful too add a gift bracket and then pivot and visualize those ranges. In the example below, I am adding a gift range and then visualizing what kind of gifts (small – large) generated most of the revenue for a particular zip code. It is interesting to see that low level gifts ($100 – $500) produced majority of contributions, while very low gifts (less than $100) produced a much smaller share. I would recommend to the fundraising team to adjust the ask amount accordingly.

To get to those ranges is a three-step process. The first part is two build a gift range reference table. It can be done through an upload of an excel/CSV spreadsheet or by building a table using DAX. Here is the code that I used in the sample dashboard above.
Gift Ranges = DATATABLE( “RangeKey”, INTEGER, “Gift Range”, STRING, “MinValue”, CURRENCY, { { 1, “Refund”, -10000}, { 2, “Very low”, 0}, { 3, “Low”, 100}, { 4, “Medium”, 500}, { 5, “High”, 1000}, { 6, “Very high”, 5000} } )
The second part is to build a RangeKey calculated column in the Contribution Detail table. This code will iterate for each contribution and will assign it to a gift range bracket.
RangeKey =
— iterator over Contribution Details —
MAXX(
— For each contribution_receipt_amount greater than minimum range value add a max range key
FILTER(‘Gift Ranges’,
— For $250 contribution, it will be greater than the low minimum value, but less than the medium minimum
‘Contribution Details'[contribution_receipt_amount] > ‘Gift Ranges'[MinValue]
— max rangekey for low range is 3
), ‘Gift Ranges'[RangeKey]
)
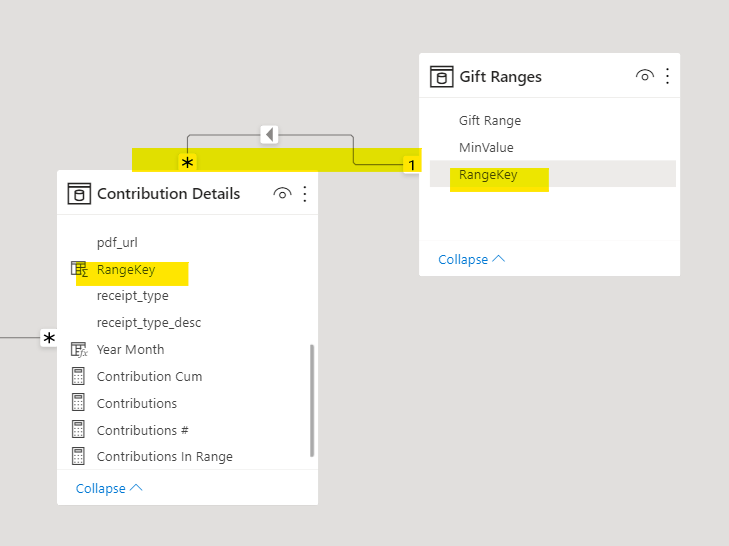
The last step in the process is to connect Contribution Detail to the Gift Ranges table with Gift Ranges one to Contribution Detail’s many side.


