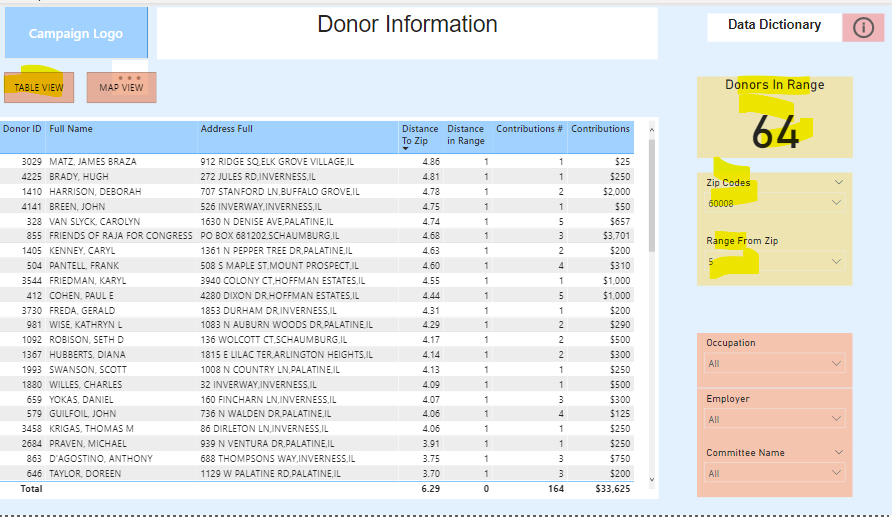
Here is an example of a dashboard that I created using public FEC data. The data is similar to many donor and sales files. The dashboard will allow you to pick donors based on proximity to a selected zip code. It can be applied to sales territories or picking a prospective donor lists for specific campaigns. Here is one of the final views. In the rest of the post, I will expand a little more on the process and details of the calculations.
Here is a link for the PBIX file. Feel free to use it as a template.

Step 1. Geo-code address of the donors and target zip codes.
In order to pick donors/prospects within certain miles of zip codes, the first step is to geo-code donor’s addresses and zip codes. Geo-coding turns an address into latitude and longitude coordinates that later can be used to calculate distance. To geo-code a few addresses and zip codes, it is possible to use free website such as this. However, in case of thousands of records individual entry will not work. Many companies have paid services, but for this example, I used free google sheets plug in called Geo Coding By Awesome Table. This add-on allows to geo-code up to 1000 records per day.
Step 2. Calculate the distance between addresses and zip codes.
Google returns degrees for addresses and zip codes. DAX formula below creates variable for addresses and zip codes. Then, degrees are converted to radians. Then, average distance between donor address and zip code is calculated in radians, and then converted to miles. Refer to the Distance To Center measure in the PBIX.
Distance To Center =
VAR Lat1 =
MIN ( ‘Zip Codes'[Latitude] )
VAR Lng1 =
MIN ( ‘Zip Codes'[Longitude] )
VAR Lat2 =
MIN ( ‘Main Donor Table'[Latitude] )
VAR Lng2 =
MIN ( ‘Main Donor Table'[Longitude] )
VAR P =
DIVIDE ( PI (), 180 )
VAR A =
0.5
– COS ( ( Lat2 – Lat1 ) * p ) / 2
+ COS ( Lat1 * p )
* COS ( lat2 * P )
* (
1
– COS ( ( Lng2 – Lng1 ) * p )
) / 2
VAR final =
( 12742 * ASIN ( ( SQRT ( A ) ) ) ) * 0.621371
RETURN
final
Step 3. Checking the distance for each record.
Next step is to build a reference table with values which will be used in evaluation of donor’ location. For the formula above to be meaningful, a user will need to pick one zip code and distance from that zip code. Here HASONEVALUE function becomes very handy. If user picks a zip code and a range, then all donors whose distance to zip code is within the range will have 1, while the rest will have 0. The final step is to set Distance In Range measure equal or greater to 1 on the visual.
Distance in Range =
SWITCH (
TRUE (),
HASONEVALUE ( ‘MaxDistance'[MaxDistance] )
&& HASONEVALUE ( ‘Zip Codes'[Zip Codes] )
&& [Distance To Center] <= VALUES ( ‘MaxDistance'[MaxDistance] ), 1,
0
)
Step 4. Adding a map.
Many sales people have geographical territories and in general are visual people. Since we already acquired geo coding, we can add a fancy map (ArcGIS Map) that shows location of the donors/prospects that they selected based on the zip code, distance and other criteria.


